Unemployment has been awful since the crisis. Things are getting better now, at least by some accounts. But it's easy to doubt such accounts, because demographic changes pull the rug out from under them. Or they seem to, anyway. It's all very confusing.
So here's a simple look at "employment" -- the number of workers in our economy. Instead of just raw numbers, I'm looking at the percent change in employment. I'm using quarterly data, not monthly, to make the graph less jiggy and easier to read:
 |
| Graph #1: Percent Change in the Total Employment |
And if you look at the trend line I threw in there, it looks like employment since mid-2010 has been right on trend. Maybe a pixel or two above trend. So I have to say it's not Obama or the Crisis or George W. Bush alone that is the source of the problem. I have to say the problem goes back at least to the 1980s. That means Reagan, and Bush the Father, and Bill Clinton are also part of the problem.
But I don't like to blame people. I like to blame policies. What I usually say (and I stand by it now) is that the problem goes back probably another 20 years before the 1980s. What that means is the problem is not unemployment.
The problem is Problem X. What we see on the graph -- declining employment since the 1980s -- was a "solution" to Problem X.
Is declining employment a problem? Well, sure. But it's not the problem. Declining employment was a solution to the problem. So our solution is a problem, yes. But again, it's not the problem. I hope this is making sense to you. I don't know how to say it any better.
Do I think I know what Problem X is? Of course: Excessive debt. Excessive finance. Financial "deepening". These are all the same. But don't think the problem started with Obama, or with Bush the Younger, or Clinton, or Bush the Elder, or even with Reagan. It would be more accurate to say the problem was already a problem the last time Lee Harvey Oswald fired his rifle.

I have to say the problem goes back at least to the 1980s. But then, doubt recurs. Demographic changes come back to haunt me. So I took the total number of employees and divided it by the total population, to get the working share of population, and looked at the percent change in that. Again, quarterly:
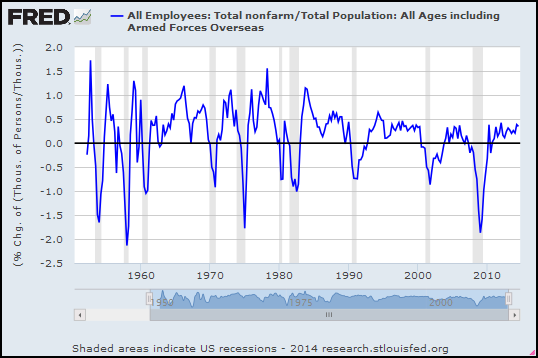 |
| Graph #2: Total Employment Relative to Total Population, Percent Change |
The trend is consistent, too. Granted, I just sketched in a straight line. But a lot of jiggles cling to that trend, in the 1980s and again in the 1990s and again in the 2000s. In comparison to this trend line, job growth for the past three years has been good (odd as that is to say). If this trend line is right, employment is well above the trend of the last 30 years. Clearly it is the last 30 years for which unemployment has been a problem, not the last three.
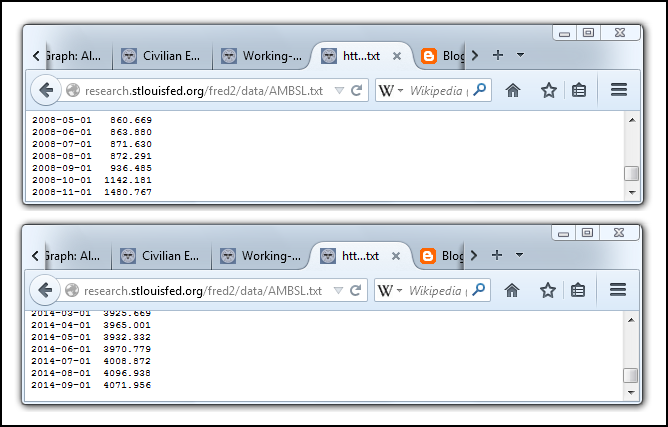
I found a quarterly, seasonally adjusted dataset at FRED for Working Age Population: Age 15 and Over for the United States. Starts at 1955. Maybe that's a better context than the whole U.S. population?
The Working Age Population series counts persons... The Employment series counts thousands of persons... I'll multiply the Employment number by 1000 to convert it to persons so the units match. I probably don't need to do that if we're looking at percent change numbers. But what the heck.
Again, a look at percent change:
 |
| Graph #3: Total Employment Relative to Working Age Population, Percent Change |
For the Working Age Population data, FRED wants the source cited:
Working Age Population: Aged 15 and Over: All Persons for the United States©
OECD descriptor ID: LFWATTTT
OECD unit ID: STSA
OECD country ID: USA
All OECD data should be cited as follows: OECD, "Main Economic Indicators - complete database", Main Economic Indicators (database),http://dx.doi.org/10.1787/data-00052-en (Accessed on date)
Copyright, 2014, OECD. Reprinted with permission.
Source: Organisation for Economic Co-operation and Development

1 comment:
It occurs to me that the 30-year slowdown in employment growth shown above, the 30-year slowdown in RGDP growth, and Okun's law all stand together, each helping to confirm the others.
Post a Comment